By Sara Kidd, GIS, Data, and Analytics Manager, HRPDC/HRTPO and KC Filippino, Senior Water Resources Planner, HRPDC
How is Hampton Roads changing over time? Thanks to newly released high-resolution land use and land cover data, we now have a clearer picture than ever before. This month’s featured map highlights the 1-meter resolution imagery that captures how our landscape has evolved between 2013, 2018, and 2021 — and it’s available for free to download.
Developed in partnership with the Chesapeake Bay Program, the U.S. Geological Survey (USGS), and the Chesapeake Innovation Center (CIC), this data gives local governments and planners the tools they need to understand how development, agriculture, forests, and even solar facilities have reshaped our region over the past several years.
Why This Data Matters
For the first time, we can track changes over three key points in time — comparing 2013 to 2018, 2018 to 2021, and 2013 to 2021. These shifts are displayed in maps, tables, and interactive viewers, allowing users to toggle between years and see changes with just a click.
Some examples of the landscape transitions include:
- Forests converted to residential developments or solar farms
- Agricultural lands shifting to turf grass or other uses
- Short-term harvested forests becoming long-term developed areas
These insights are more than just visual — they directly support better decision-making. The data feeds into the Chesapeake Assessment Scenario Tool (CAST) model, which tracks nutrient loads entering the Bay and helps evaluate the impacts of land use decisions on water quality.
What We’re Seeing in Hampton Roads
A snapshot of the Hampton Roads region reveals some important trends:
- Loss of forested lands as they transition to harvested forests, agriculture, solar facilities, or developed areas
- Increases in transitional land uses, such as forests converted to turf grass
- Emerging development patterns that can inform future planning decisions
This information empowers localities to better manage growth, protect natural resources, and plan for the future.
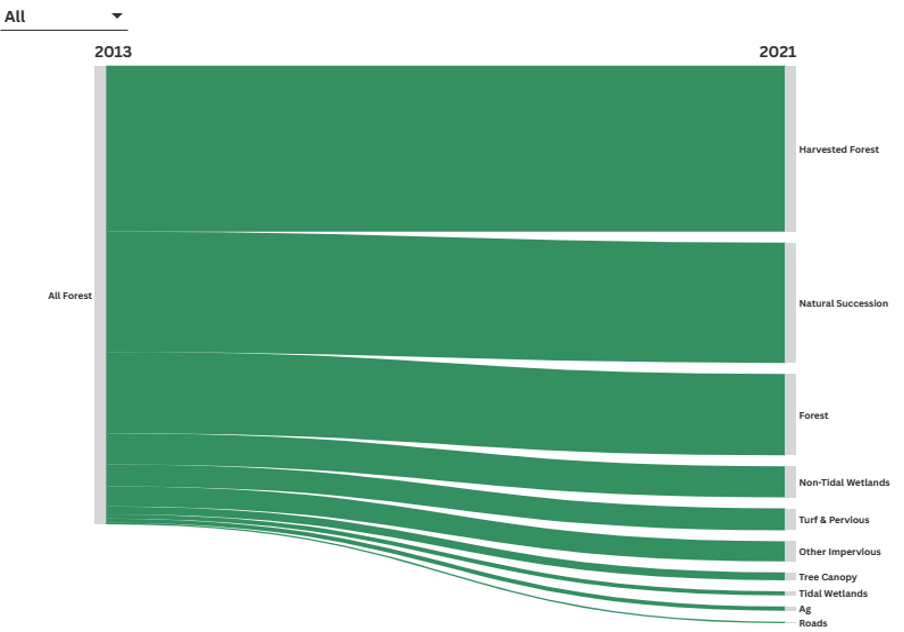
This diagram shows the transition of forested acres to all other land cover types in Hampton Roads between 2013 and 2021.
Explore the Interactive Map
The interactive Map of the Month lets users:
- View detailed land use and land cover changes for Hampton Roads
- Toggle between historic imagery and the most recent 2021 data
- Explore bookmarked locations highlighting examples of landscape transformation, from new residential developments to large-scale solar facilities in transition
Instructions are provided in the tool on how to use the swipe maps feature to compare different years.
By seeing where and how our landscapes have changed, we can make smarter, data-driven decisions that balance growth with environmental stewardship.
Click to view map in a new window